I turned a newsletter’s research into 294.9K impressions on X/Twitter in six tracked weeks
I ran X/Twitter for an investment research newsletter that covers banking, fintech, software and macro. I turned their research into posts and threads, designed the graphics and replied in finance conversations every day.
- Content strategy
- Threads
- Visual concepts
- Community
- Reporting
Results
Six weeks, one week at a time
Tap a week to see its numbers.
impressions
engagement rate
engagements
profile visits
bookmarks
reposts
shares
posts
Jan W2 was the first week I tracked, with 12 posts.
impressions
engagement rate
engagements
profile visits
bookmarks
reposts
shares
posts
Jan W3 had the biggest reach of the six weeks but the lowest engagement rate, 2.4%.
impressions
engagement rate
engagements
profile visits
bookmarks
reposts
shares
posts
We went up to 20 posts in Jan W4. Reach dropped and engagement rate stayed at 2.4%.
impressions
engagement rate
engagements
profile visits
bookmarks
reposts
shares
posts
Feb W1 had 20 posts again, and engagement rate went up to 2.9%.
impressions
engagement rate
engagements
profile visits
bookmarks
reposts
shares
posts
Feb W2 had the lowest reach of the six weeks, but engagement rate kept climbing to 3.3%.
impressions
engagement rate
engagements
profile visits
bookmarks
reposts
shares
posts
Feb W3 had only 10 posts and got the best engagement rate, the most bookmarks and the most engagements of any week.
Total across the six weeks
impressions across six tracked weeks
total engagements
peak weekly engagement rate
bookmarks in the best week
Swipe for more →
Bars: impressions. Line: engagement rate.
The best week had the fewest posts. Feb W3 had 10 posts and got a 4.8% engagement rate and 150 bookmarks. The two 20-post weeks got 2.4% and 2.9%.
The system
From research to daily X/Twitter content
How one piece of research became posts, threads, graphics and replies.
Selected visuals
Covers that explain the idea in one picture
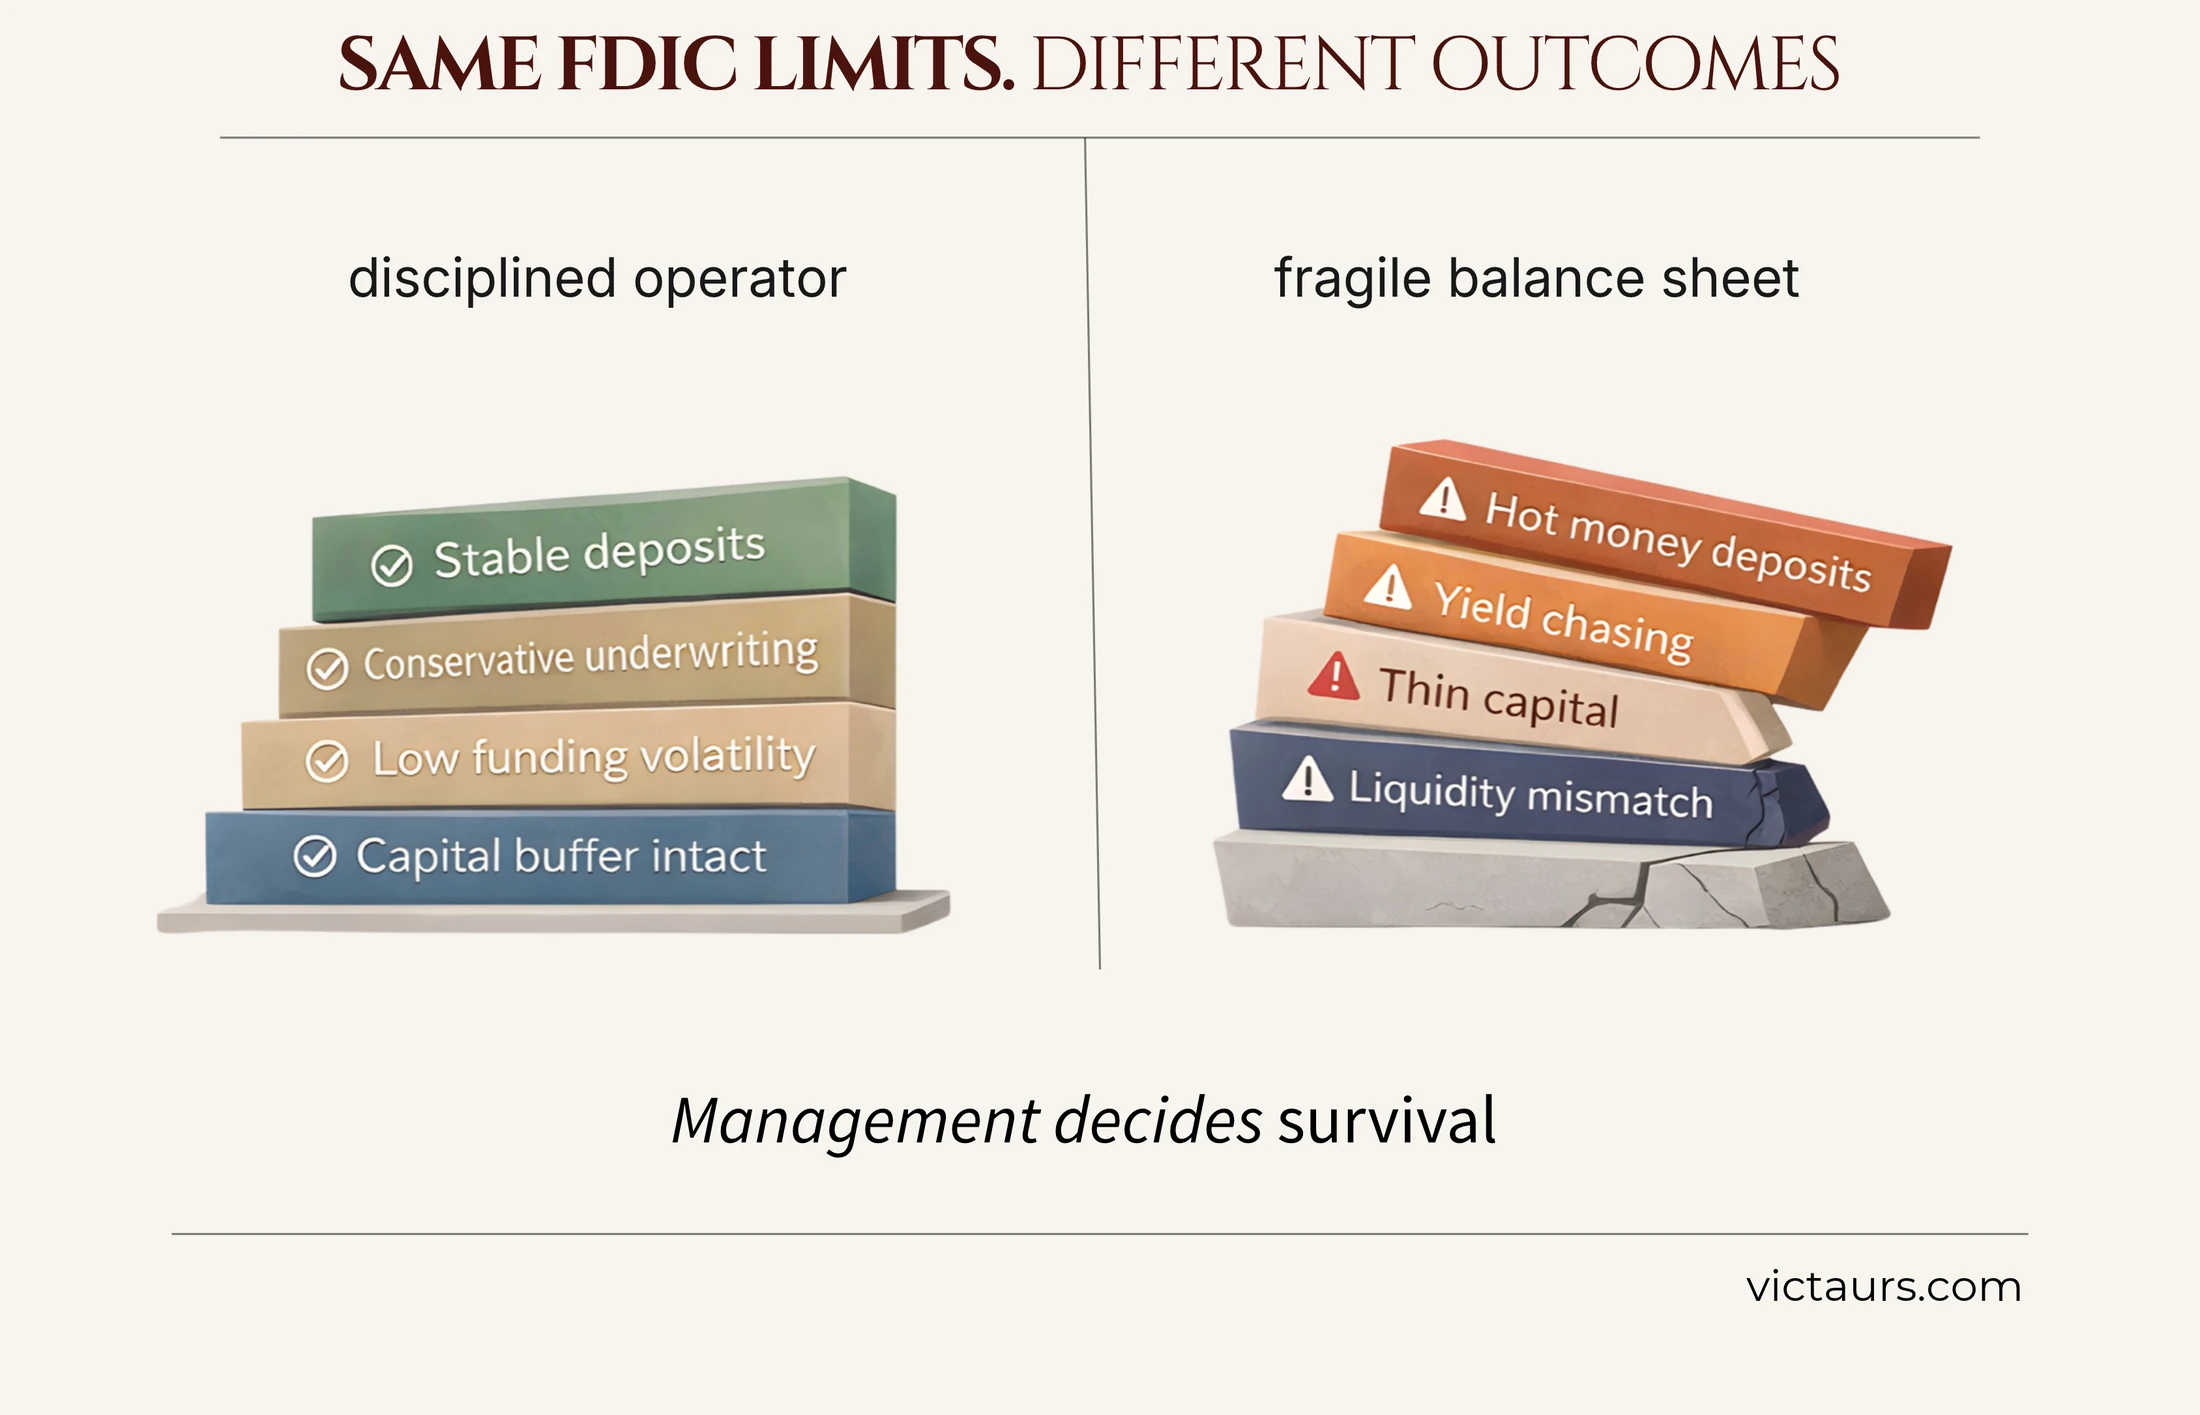
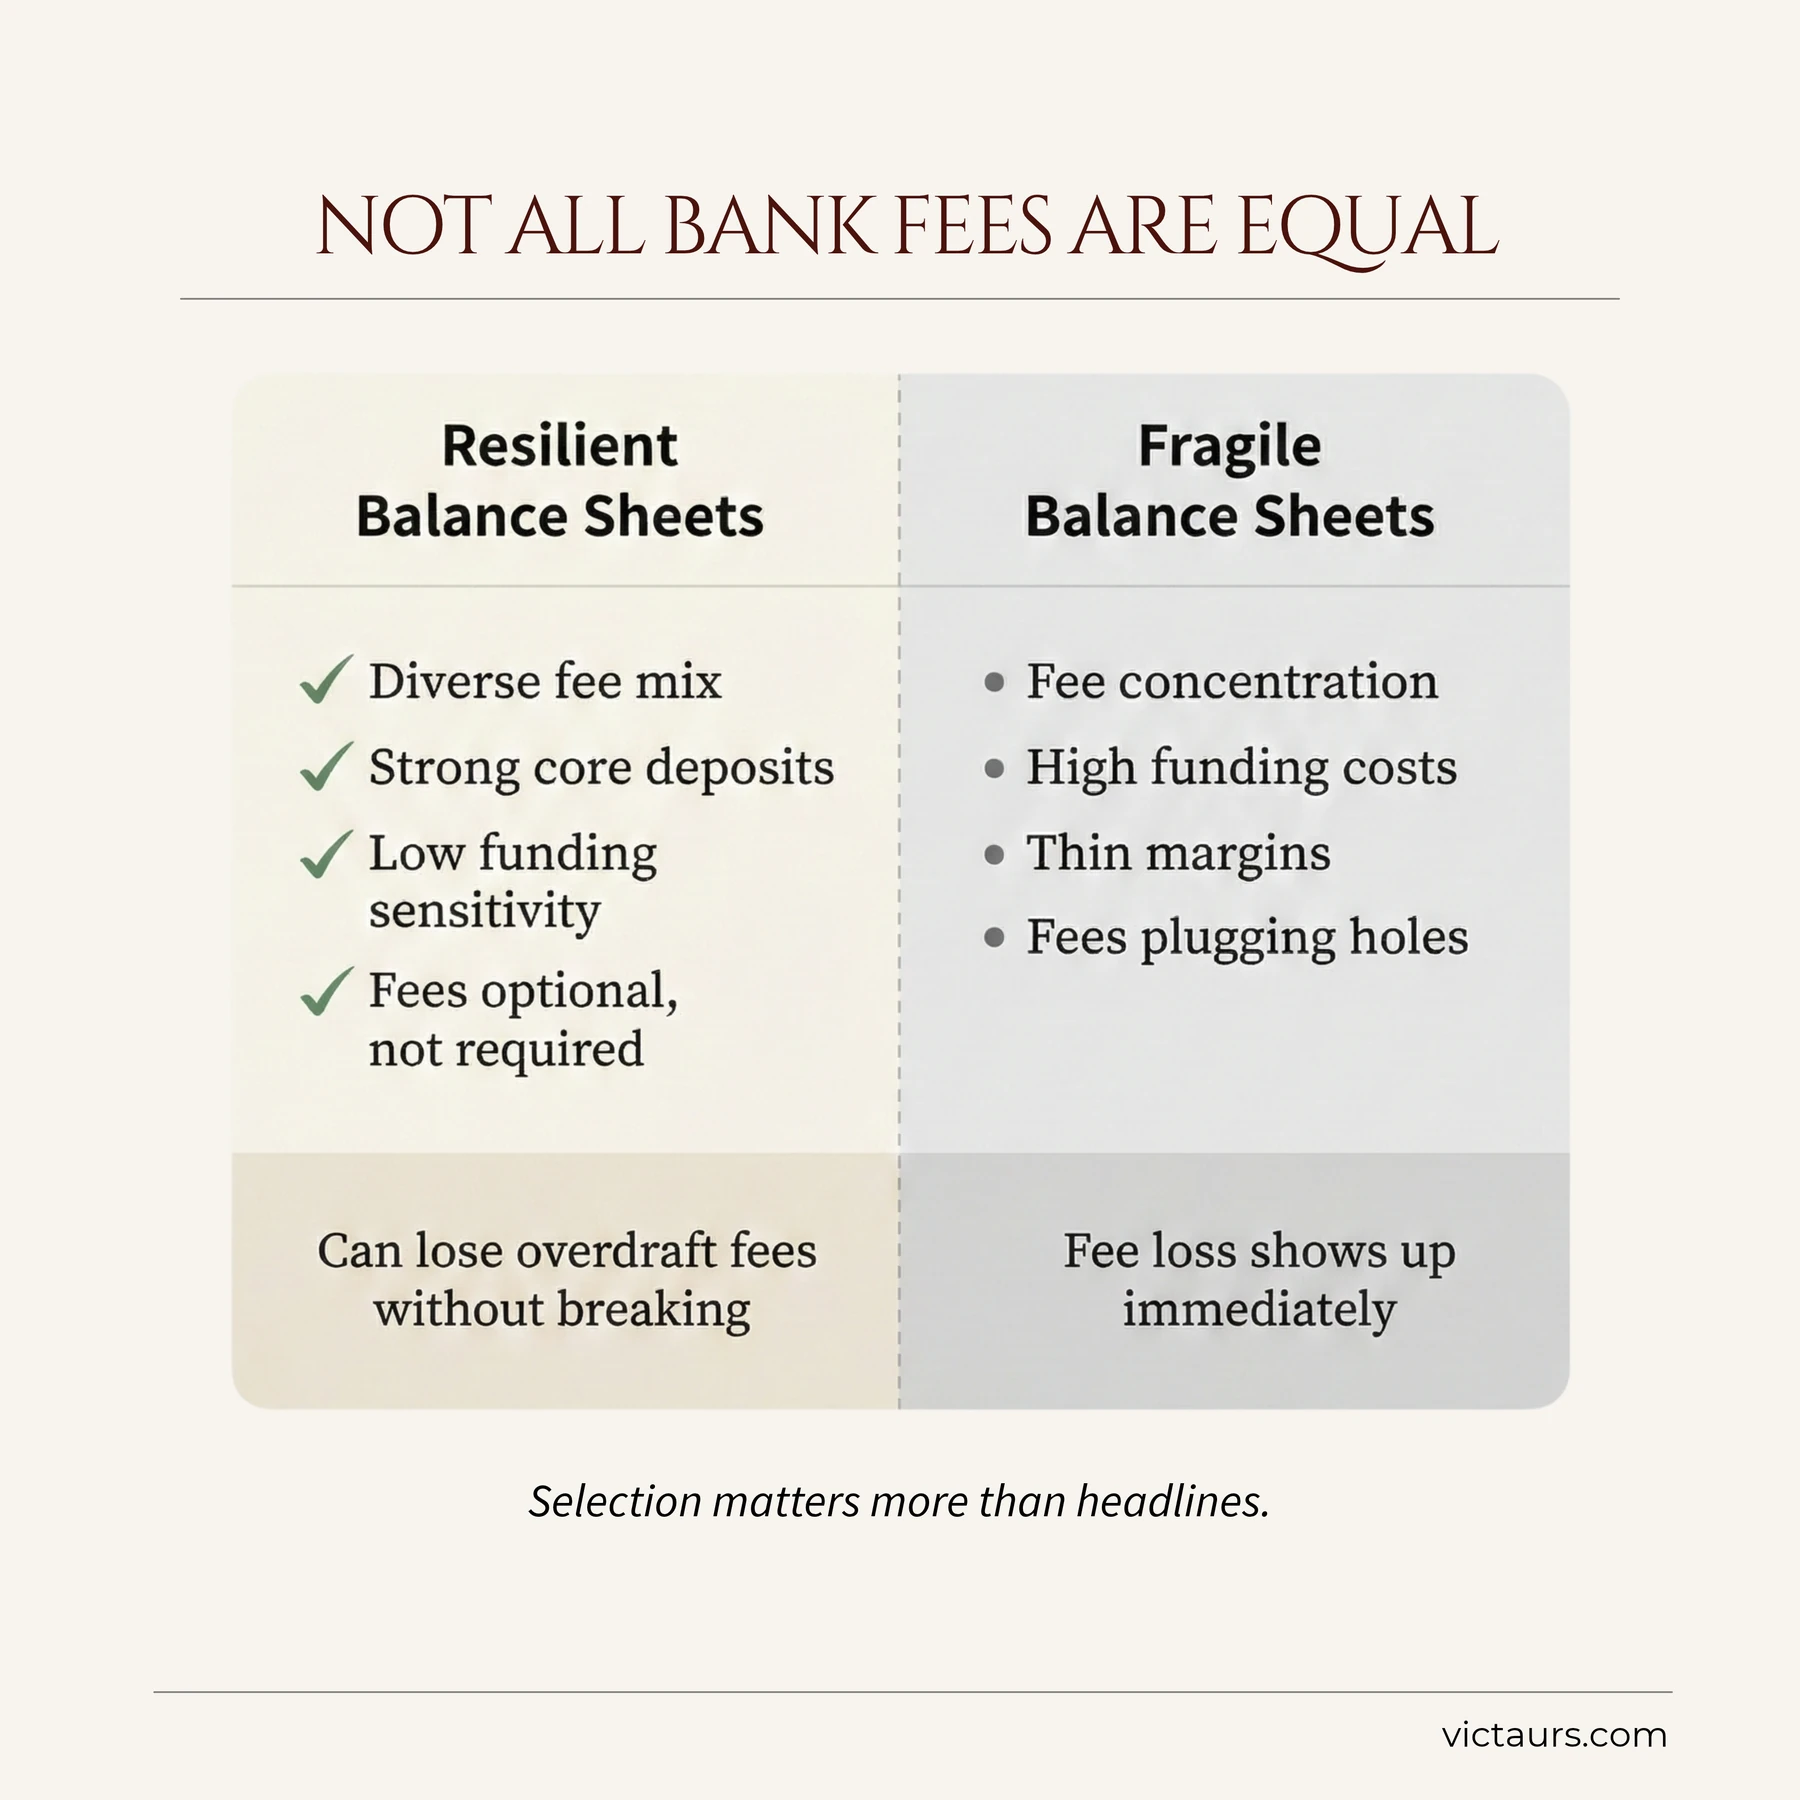
Each thread got its own cover, and some were animated too. Swipe through.
Swipe for more →
Recurring format
Victaurs Dictionary
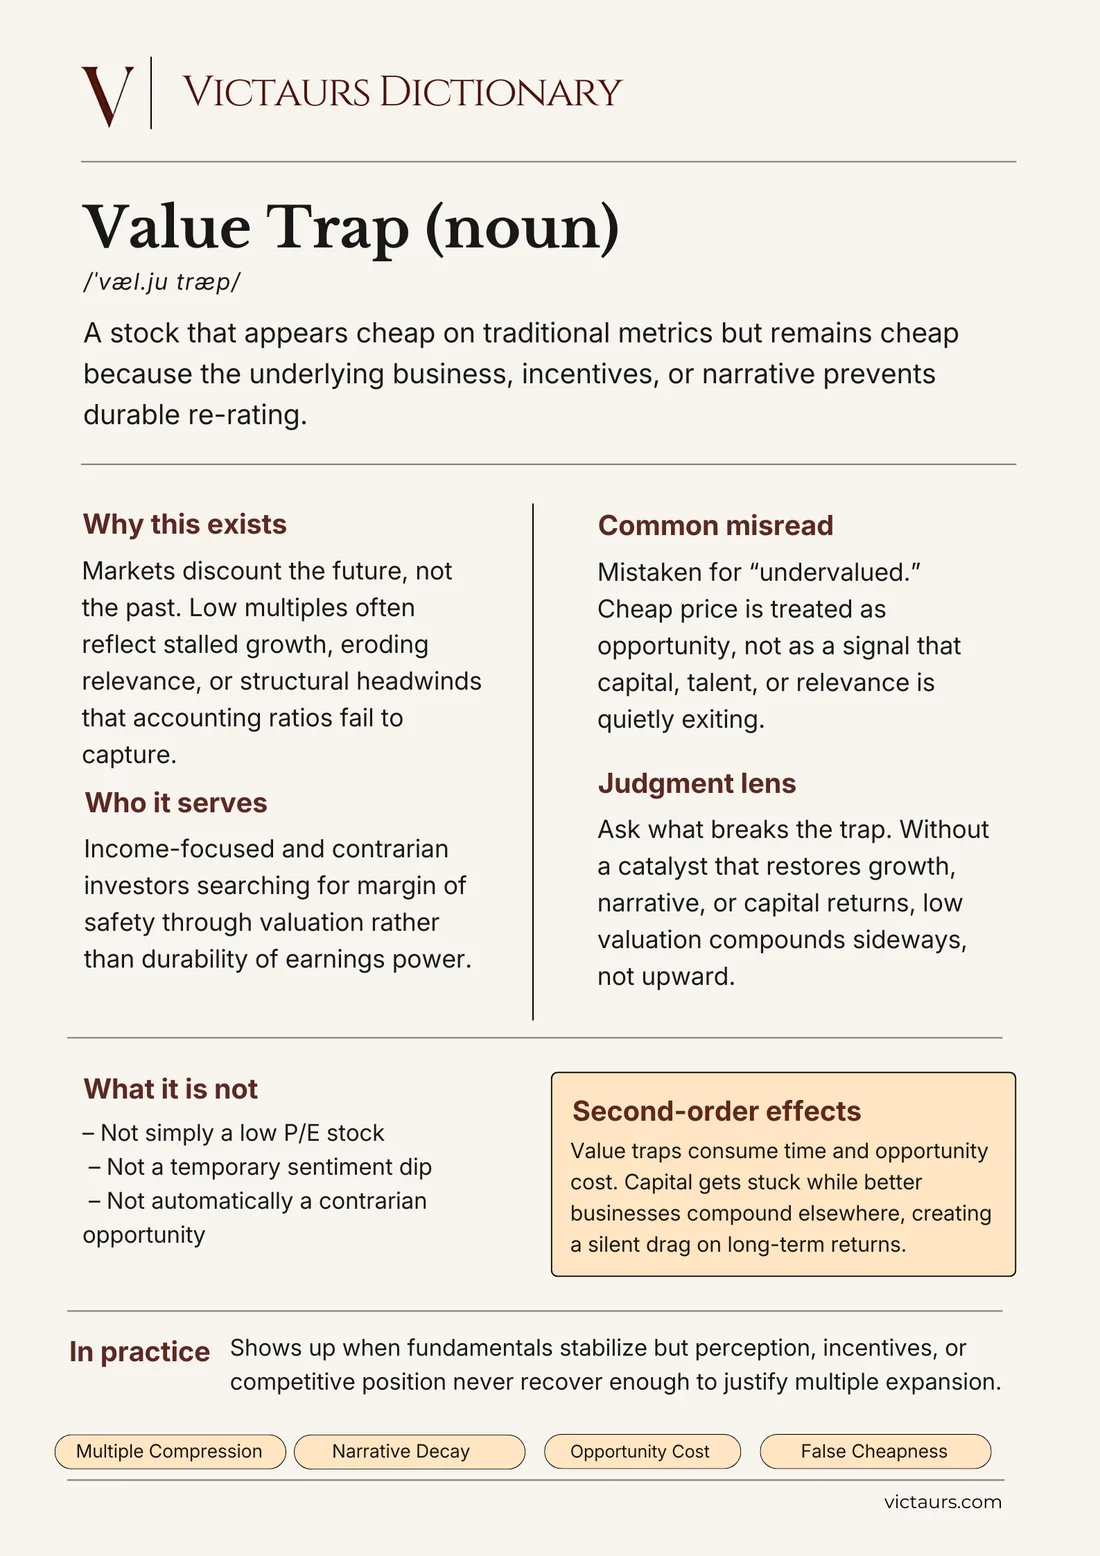
A regular series that explained one finance term at a time in plain English. We wanted something people would save and share, so each entry went further than the definition.
Each one covered why the term exists, how people misread it and what to watch next. Using the same layout every time made the series easy to spot in the feed.
Anatomy of an entry
- The definitionOne plain sentence.
- Why this existsThe market logic behind the term.
- Common misreadWhere people get it wrong.
- Judgment lensThe question to ask next.
- What it is notThree quick boundaries.
- Second-order effectsWhat it costs over time.
- Who it servesThe investor it fits.
- In practiceHow it shows up.
Published records
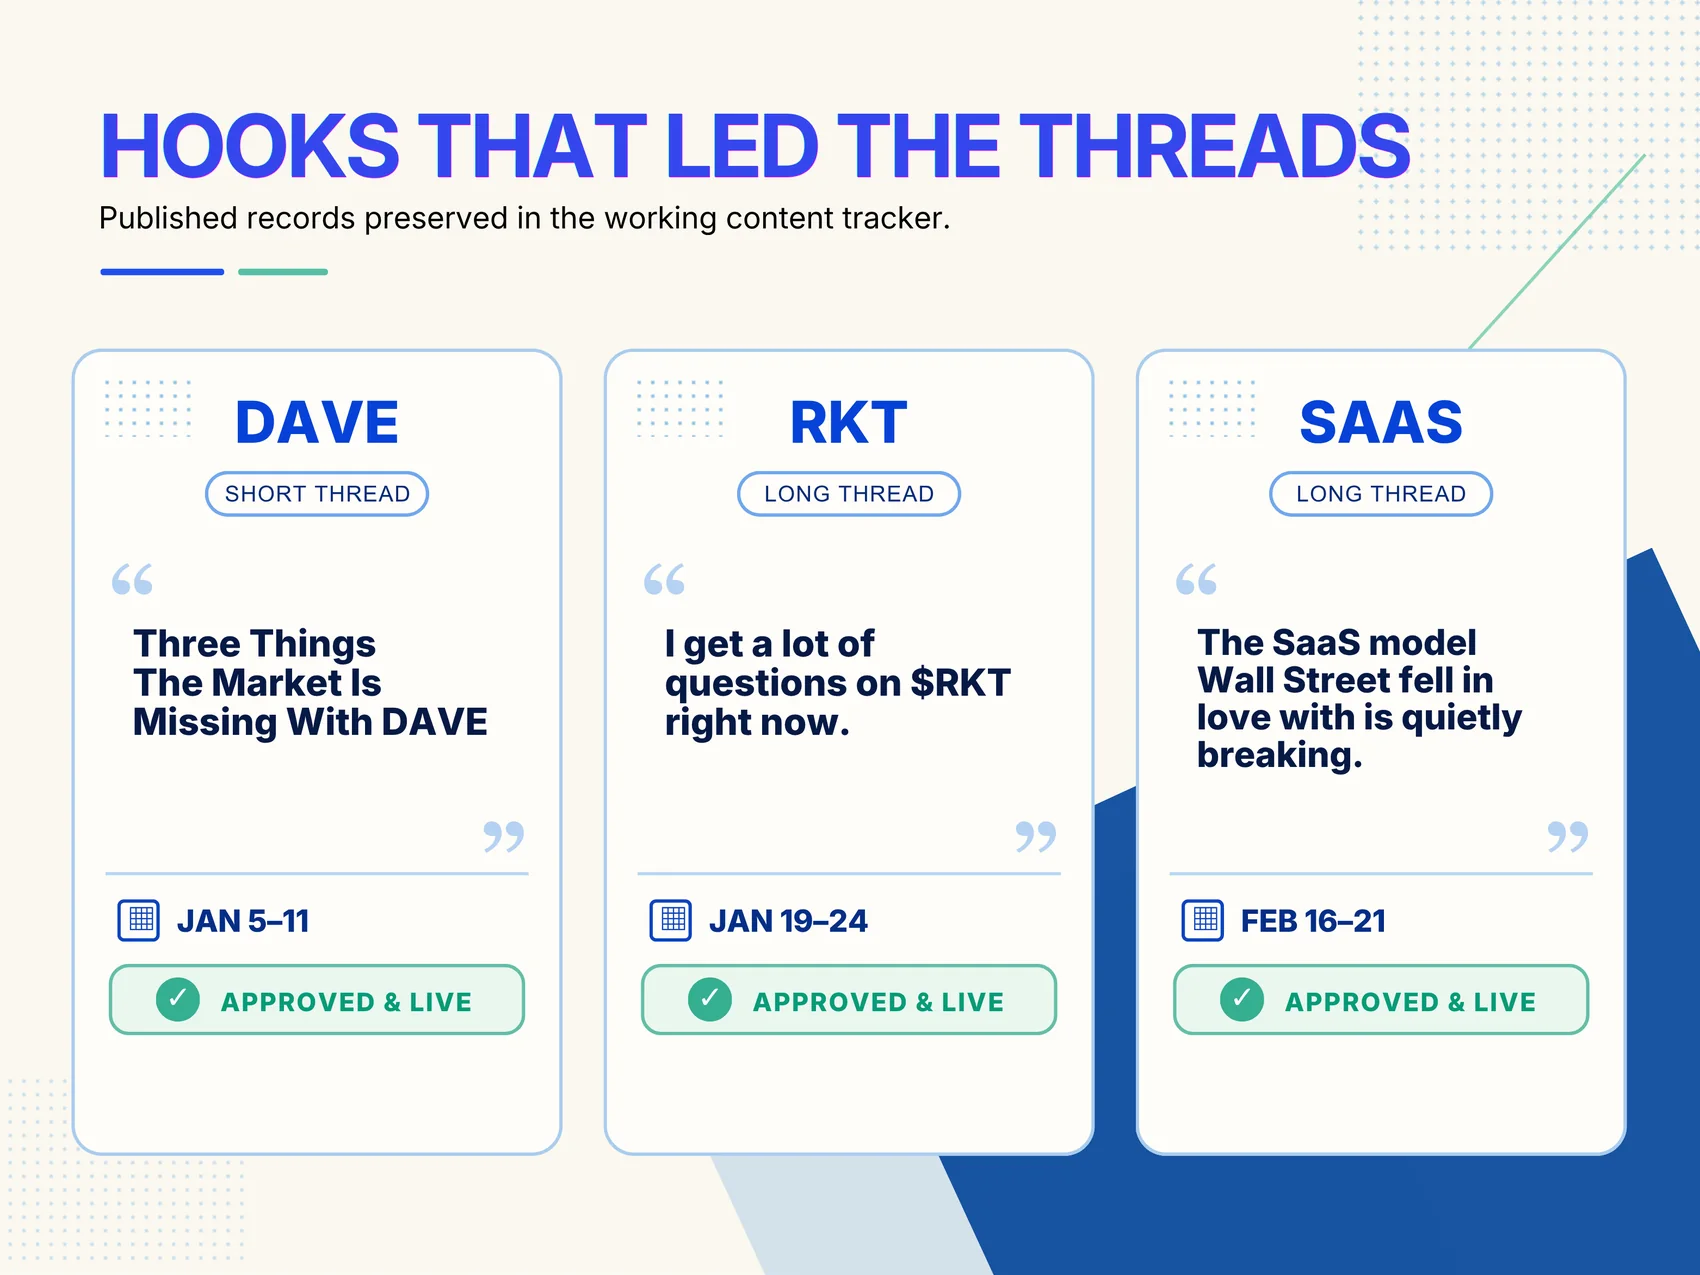
Hooks that led the threads
The original X/Twitter account was later removed. These records come from the working content tracker.
Community
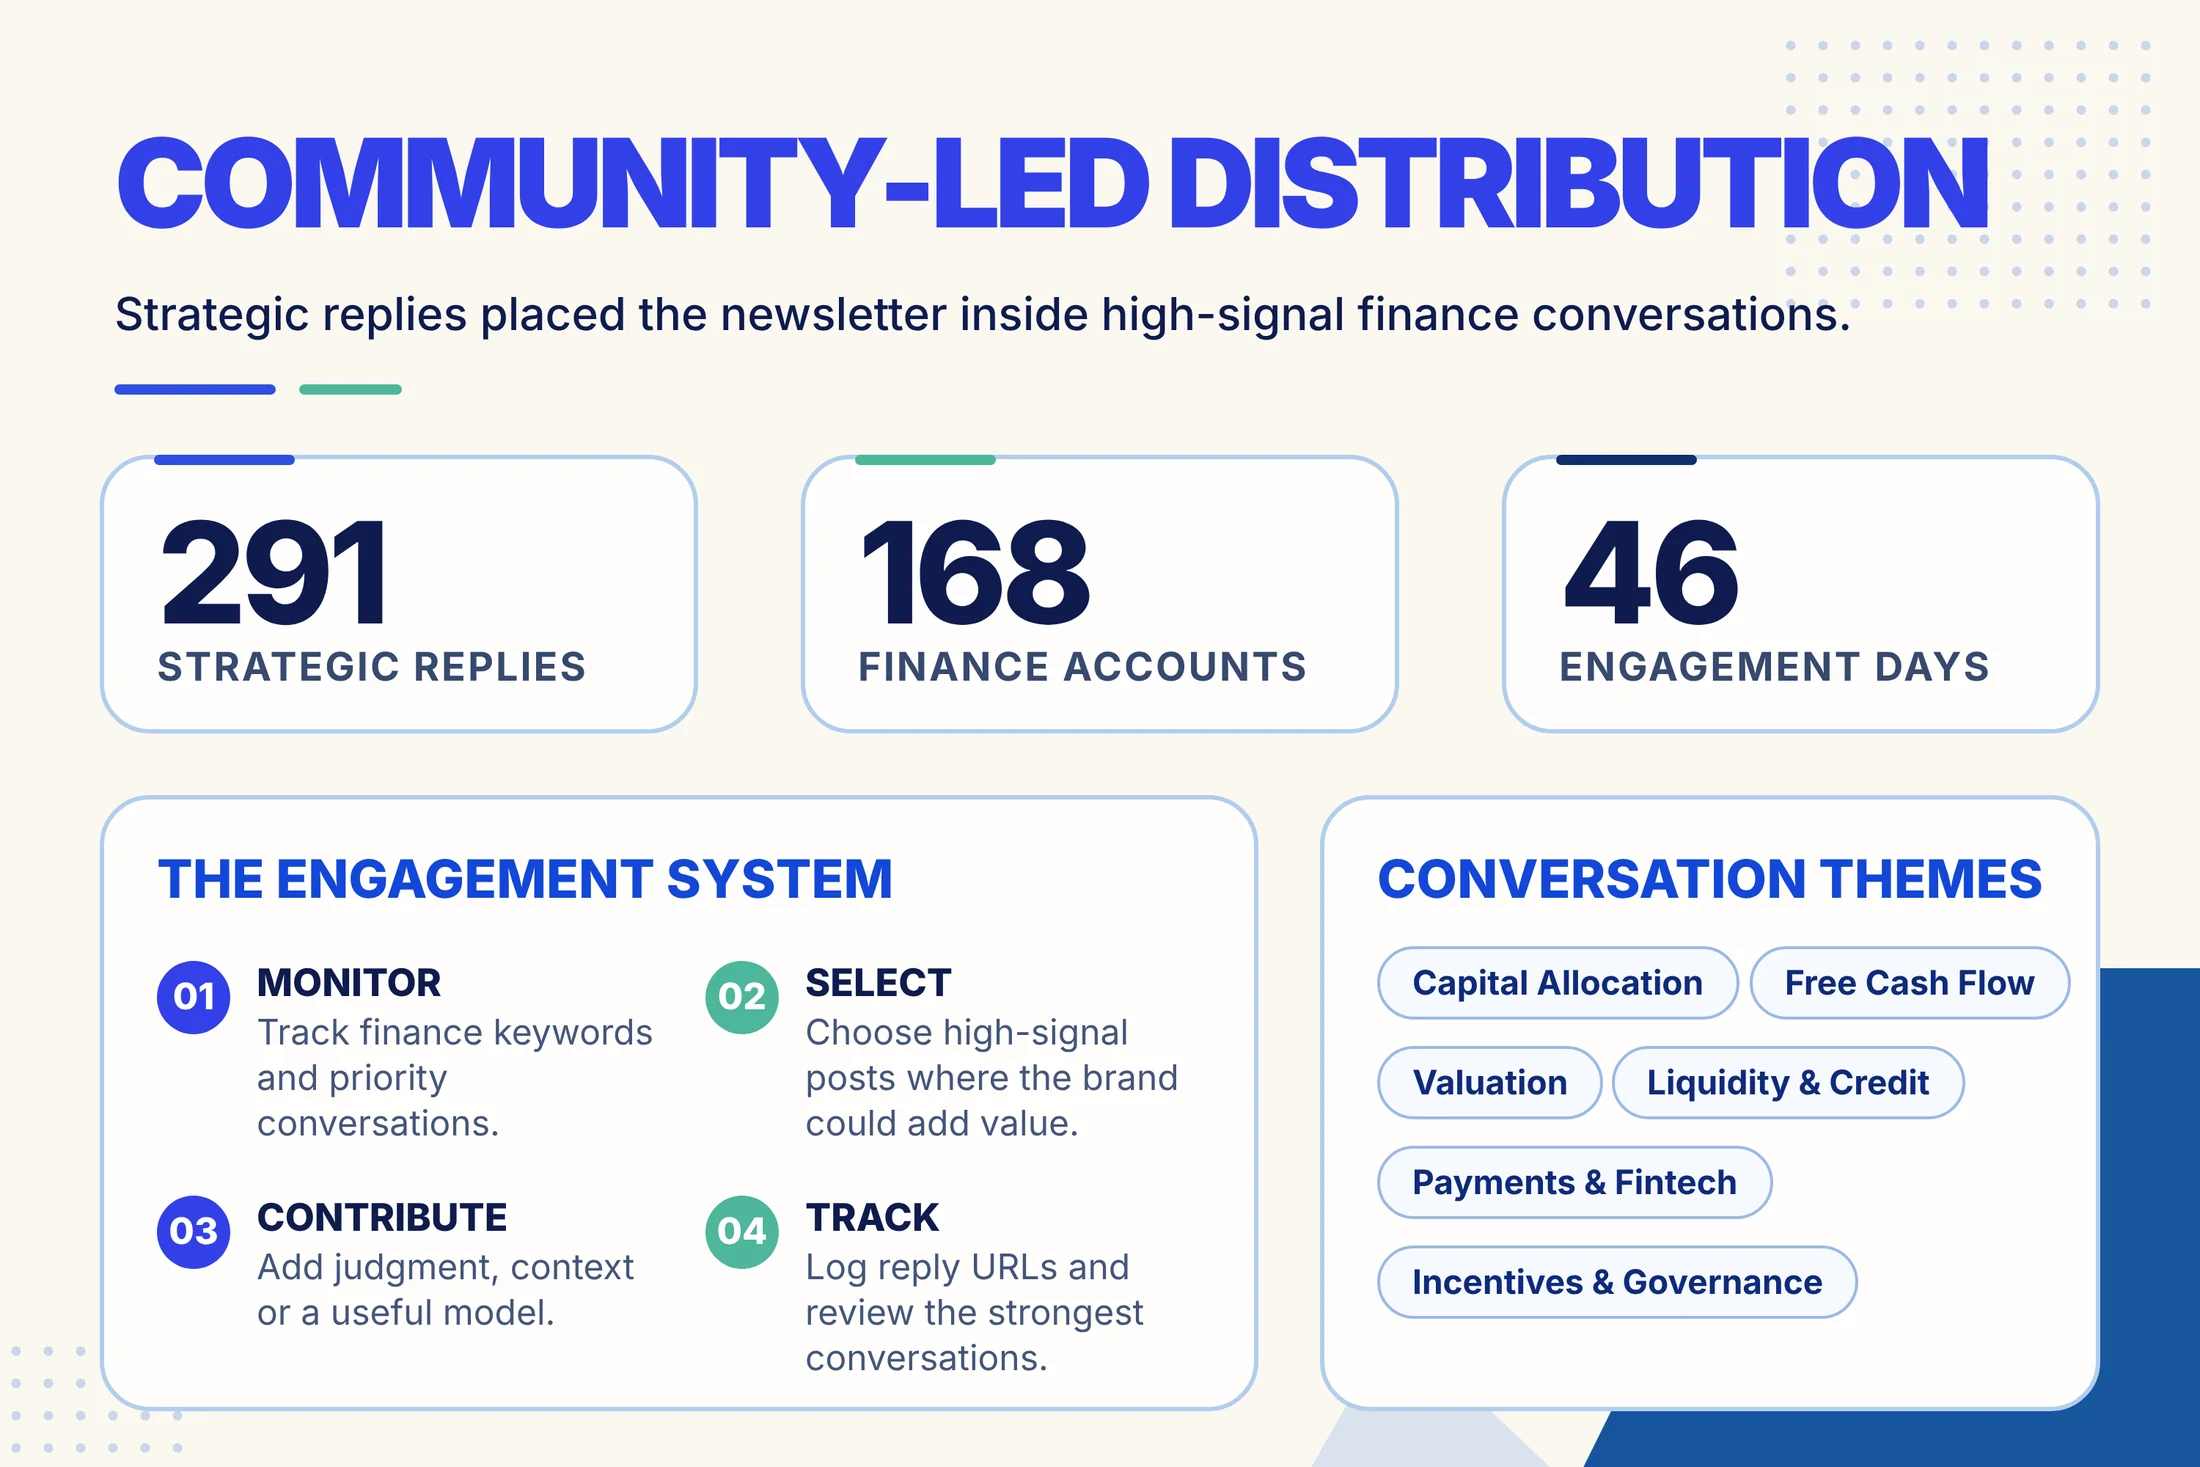
Replying where finance people were already talking
I kept a keyword watchlist and replied every day in finance conversations that were already getting attention. Each reply had to add an opinion, some context or a quick model.
Operations
One tracker for everything
One tracker held everything from research and drafts to approvals, publishing and the weekly numbers. Here are three parts of it.
Planning and approvals
Every post had a format, an idea, a status and a same-day engagement check.
Swipe for more →
Content plan · Week of Jan 19 to 24Excerpt, rows trimmed
| # | Format | Core idea | Feedback | Status | Engagement |
|---|---|---|---|---|---|
| 1 | Quote tweet | AI isn’t a race for features. It’s a contest for choke points. | Approved | Live | Done |
| 2 | Long thread | I get a lot of questions on $RKT right now. | Approved | Live | |
| 7 | Long thread | VDictionary | Approved | Live | Done |
| 9 | Single tweet | The bull case for $RIOT isn’t a higher $BTC price. | Approved | Live | Done |
| 10 | Long thread | $LDI is ripping, insiders are selling, and analysts are still cutting targets. | Approved | Live | Done |
| 13 | Single tweet | $NVDA isn’t broken. It’s stuck. | Approved | Live | Done |
Community watchlist
Saved X/Twitter searches with a minimum number of likes, so I only replied where people were already engaging.
Swipe for more →
Community engagement · Keyword watchlistExcerpt, rows trimmed
| Keyword | X/Twitter search query | Min signal | Priority | Notes |
|---|---|---|---|---|
| capital allocation | “capital allocation” min_faves:50 | 50+ likes | High | CEO letters, buybacks, ROIC talk |
| unit economics | “unit economics” min_faves:30 | 30+ likes | High | Margins, CAC/LTV, payback |
| free cash flow | “free cash flow” min_faves:50 | 50+ likes | High | Quality of earnings, reinvestment |
| liquidity | “liquidity” “credit” min_faves:50 | 50+ likes | High | Funding stress, drawdowns |
| valuation | “valuation” min_faves:50 | 50+ likes | High | Multiples vs cash flows |
| payments | “payments” OR “fintech” min_faves:50 | 50+ likes | Med | Victaurs niche overlap |
Weekly reporting
Impressions, engagement rate, bookmarks and profile visits, logged every week.
Swipe for more →
Weekly performance trackerLast two tracked weeks
| Week | Posts | Visits | Shares | Reposts | Likes | Replies | Bookmarks | Impressions | ER | Engagements |
|---|---|---|---|---|---|---|---|---|---|---|
| Feb W2 | 17 | 53 | 4 | 17 | 107 | 34 | 30 | 33K | 3.3% | 1.1K |
| Feb W3 | 10 | 149 | 18 | 20 | 173 | 29 | 150 | 56K | 4.8% | 2.7K |
Excerpts from the working tracker. Reply links and third-party details are left out.
How we worked
We wrote the voice down
We worked from a written playbook that covered the voice, formatting rules, a six-question check before posting, content pillars and the daily reply routine.
- Use real examples, not abstractions. Ground every point in a company, a number or a situation.
- Do the math out loud. Let the reader check the logic.
- Admit when you are wrong. No spin.
- Talk to the reader, not at them. Use "you" and ask questions.
- Short sentences. Let the rhythm do the work.
Week six is the one I’d point to. It wasn’t the biggest for reach, but people saved and engaged with it more than any other week.
What I delivered
- X/Twitter strategy and weekly content planning
- Research-led tweets and threads
- Visual concepts and media
- Publishing, approvals and community management
- Weekly reporting
What readers said
Readers noticed when the account went
The original @victaurs account was later removed. These are public replies from readers on X/Twitter, March 2026.
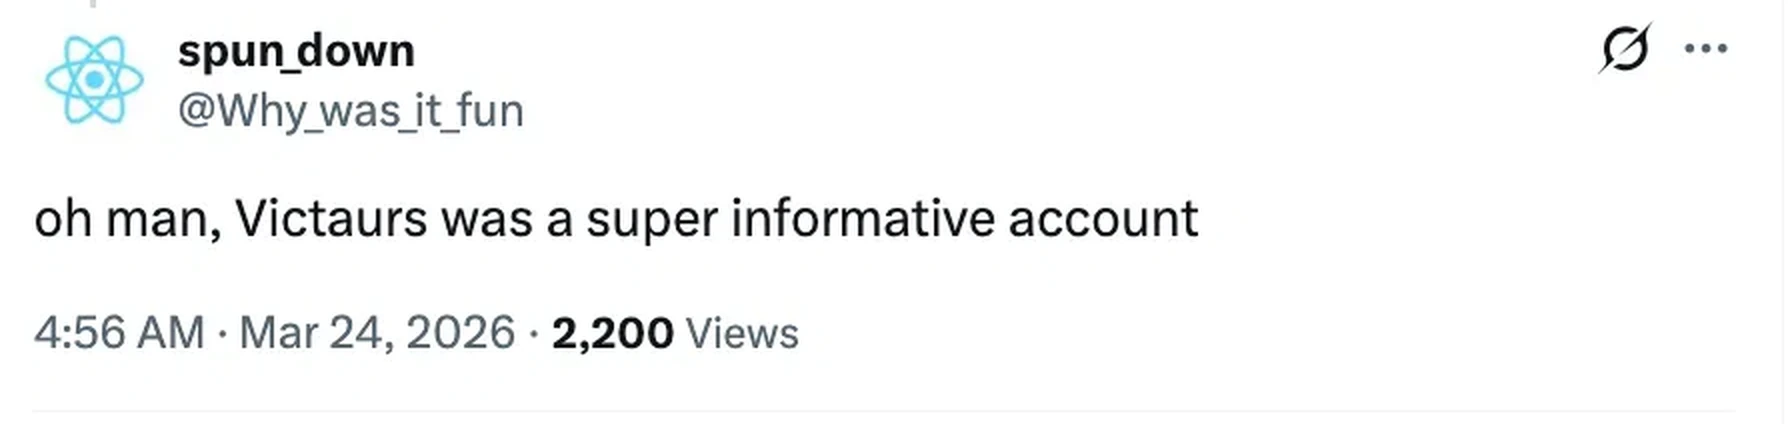
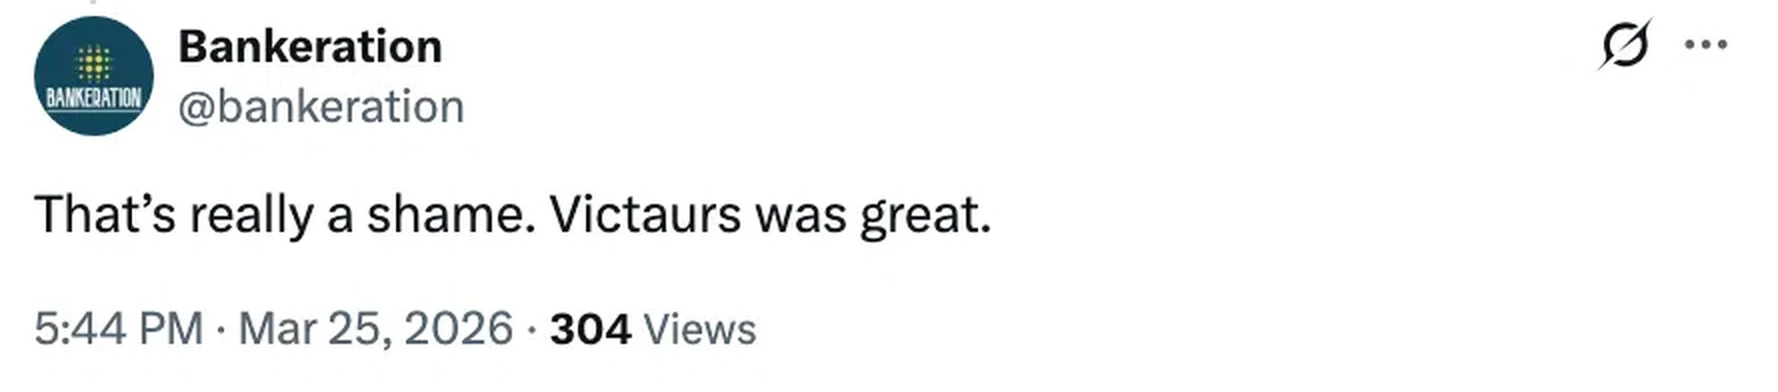
Replies from readers. Not client reviews.